
Eredivisie 2026/2027 Football Excel Fixture Prediction Download
The Eredivisie 2026/2027 Football Excel Fixture Prediction is a comprehensive football analysis and prediction workbook designed for users who want to follow the Dutch Eredivisie throughout the entire 2026/27 season. The workbook combines the official fixture schedule with team statistics, recent form, home and away performance, goals analysis, head-to-head records, league standings and automated match predictions.
The 2026/27 Eredivisie season is scheduled to begin on 7 August 2026 and finish on 23 May 2027, with 18 clubs competing across the regular 34-match league campaign. The official KNVB fixture programmed has been confirmed, while some match dates and kick-off times can still be adjusted during the season because of European competition and scheduling requirements.
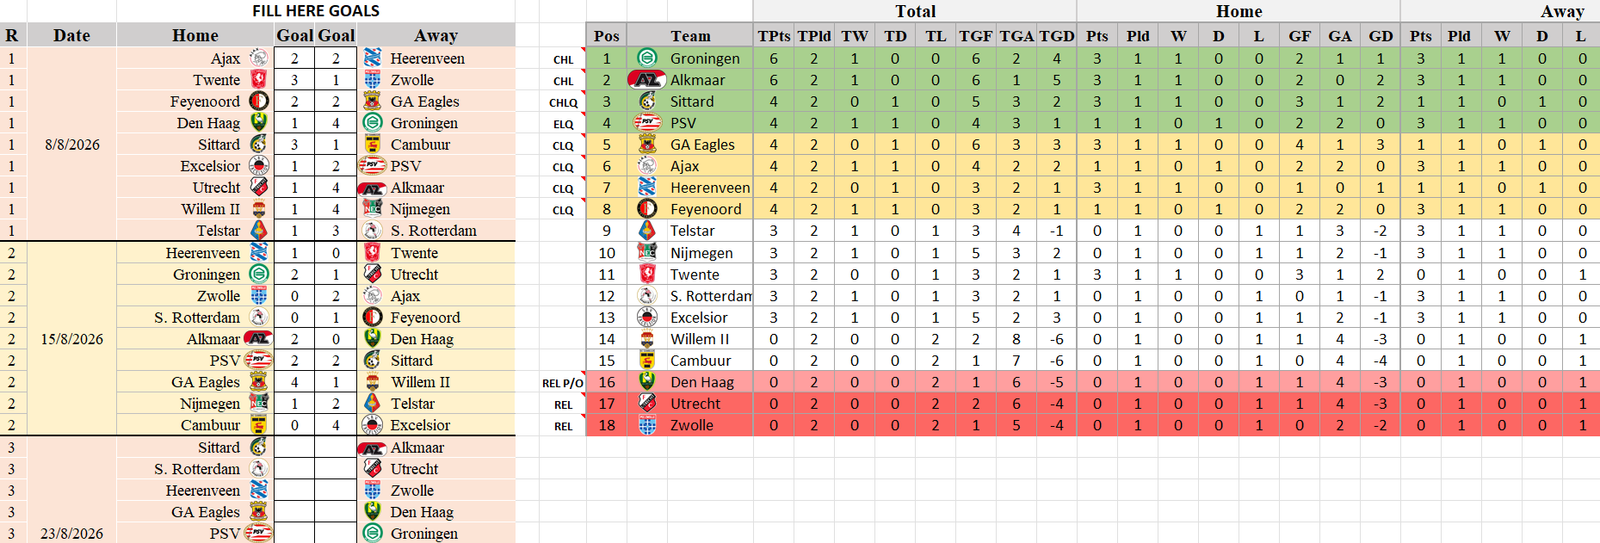
📅 Complete Eredivisie Fixture Calendar
The Excel file contains the complete 2026/2027 Eredivisie fixture calendar, organized by matchweek. Every fixture includes:
- Matchweek / Round
- Match date
- Home Team
- Away Team
- Kick-off time
- Home goals
- Away goals
- Full-time result
- Total goals
- Over/Under result
- BTTS result
- Prediction
- Prediction result
- Correct/Incorrect indicator
The season contains 34 matchweeks, giving every club a complete home-and-away schedule. The official fixture list can be updated when changes are announced by the KNVB or Eredivisie.
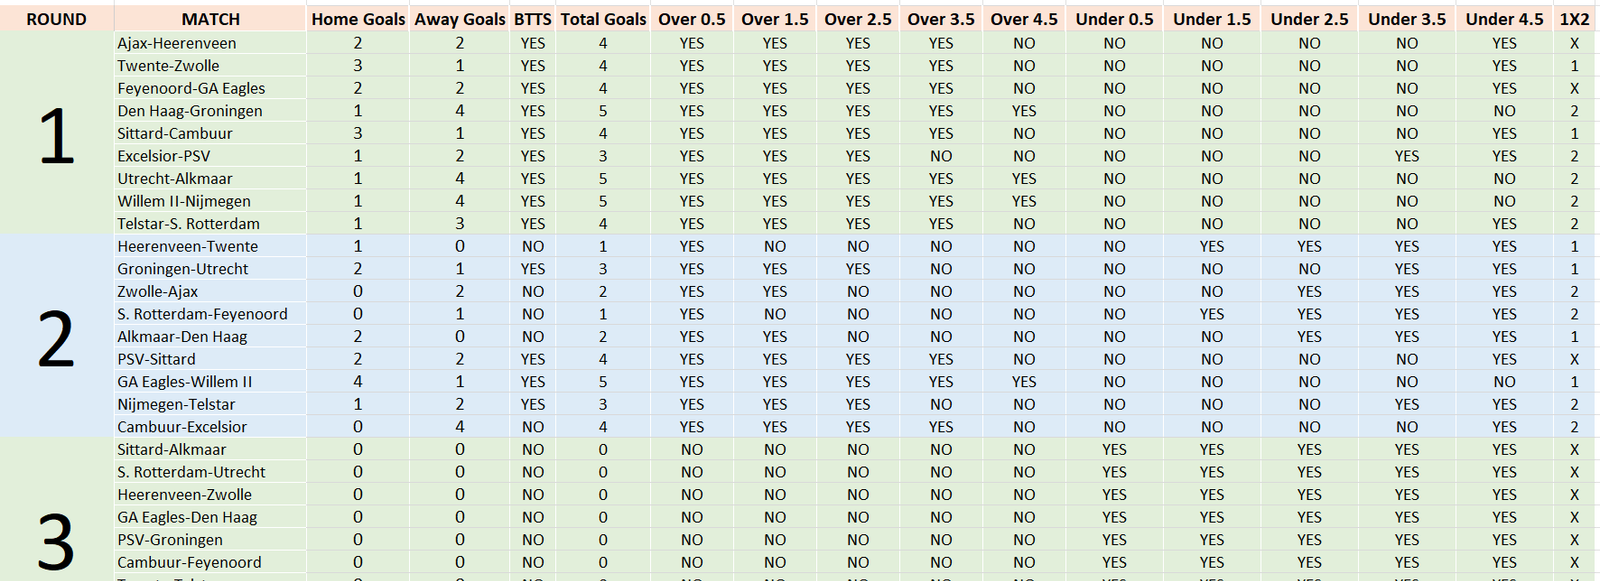
📊 League Standings
A dedicated Standings sheet automatically calculates the league table from the results entered into the workbook.
It can display:
- Position
- Team
- Played
- Wins
- Draws
- Losses
- Goals For
- Goals Against
- Goal Difference
- Points
- Home Points
- Away Points
- Home Wins
- Away Wins
- Current Form
The table updates automatically as new results are entered.
📈 Team Statistics
The workbook provides detailed statistics for every Eredivisie team. These statistics can be used as the foundation for the prediction system.
Important indicators include:
- Average goals scored
- Average goals conceded
- Home goals scored
- Home goals conceded
- Away goals scored
- Away goals conceded
- Average total goals
- Clean sheets
- Failed to score
- BTTS percentage
- Over 1.5 percentage
- Over 2.5 percentage
- Over 3.5 percentage
- Under 2.5 percentage
- Recent wins
- Recent draws
- Recent losses
- Points per game
These numbers allow the workbook to identify teams with strong attacking performances, defensive weaknesses and consistent home or away patterns.
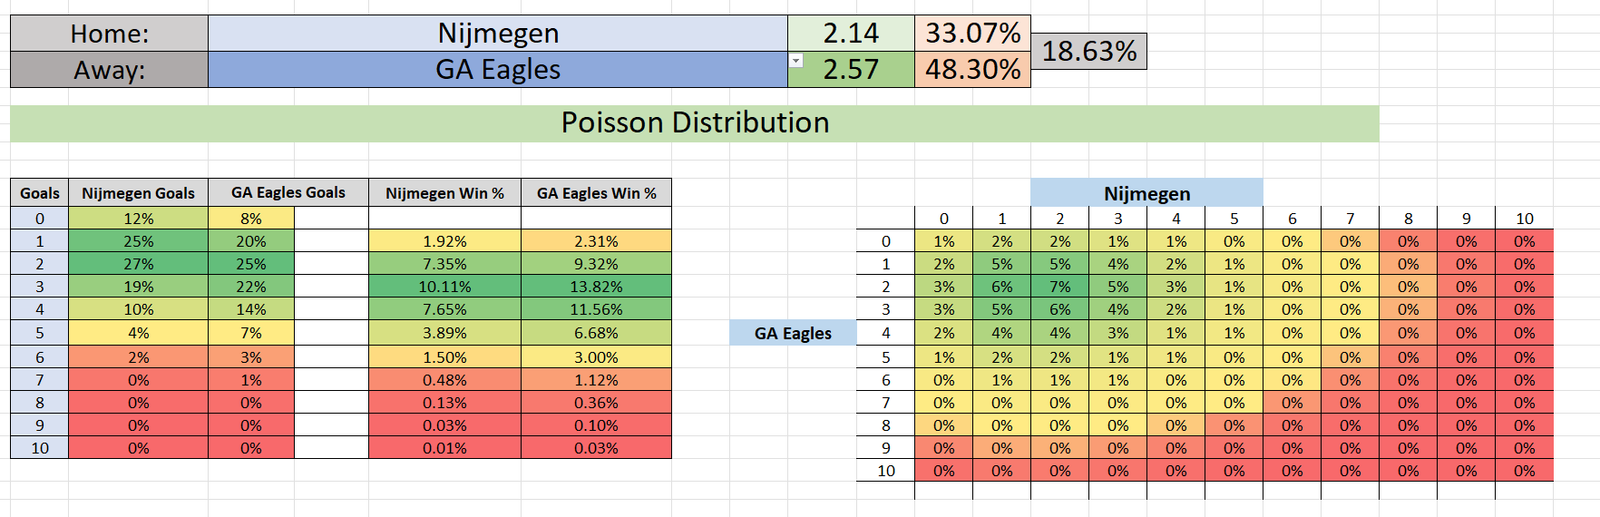
🔥 Last 5 Matches Form
The prediction system analyzes each team’s latest five matches.
For every team, the Excel file can calculate:
- Last 5 results
- Wins
- Draws
- Losses
- Goals scored
- Goals conceded
- Average goals scored
- Average goals conceded
- Points gained
- Current form percentage
This provides a more current picture of a team’s performance than relying exclusively on the league table.
📊 Last 10 Matches Analysis
The workbook also includes a longer Last 10 Matches analysis.
This section helps reduce the impact of a single unusual result and provides a larger statistical sample.
It can calculate:
- Last 10 wins
- Last 10 draws
- Last 10 losses
- Goals scored
- Goals conceded
- Average goals
- Points per game
- Over 1.5
- Over 2.5
- Over 3.5
- BTTS
- Clean sheets
The prediction can combine the last 5 and last 10 matches to create a more balanced form rating.
🏠 Home Form vs Away Form
One of the most important parts of the Eredivisie prediction model is the separation between home performance and away performance.
For the Home Team, the model analyzes its home statistics.
For the Away Team, the model analyzes its away statistics.
This can include:
Home Team
- Home wins
- Home draws
- Home losses
- Home goals scored
- Home goals conceded
- Home average goals
- Home BTTS
- Home Over 2.5
- Home clean sheets
Away Team
- Away wins
- Away draws
- Away losses
- Away goals scored
- Away goals conceded
- Away average goals
- Away BTTS
- Away Over 2.5
- Away clean sheets
This makes the prediction more relevant than simply comparing the overall league positions.
⚔️ Head-to-Head Analysis
The workbook includes a Head-to-Head section for previous meetings between the selected teams.
It can display:
- Previous meetings
- Home wins
- Away wins
- Draws
- Goals scored by each team
- Average goals
- BTTS percentage
- Over 1.5
- Over 2.5
- Over 3.5
Recent H2H results can be given a controlled weighting in the prediction model rather than allowing old matches to dominate the calculation.
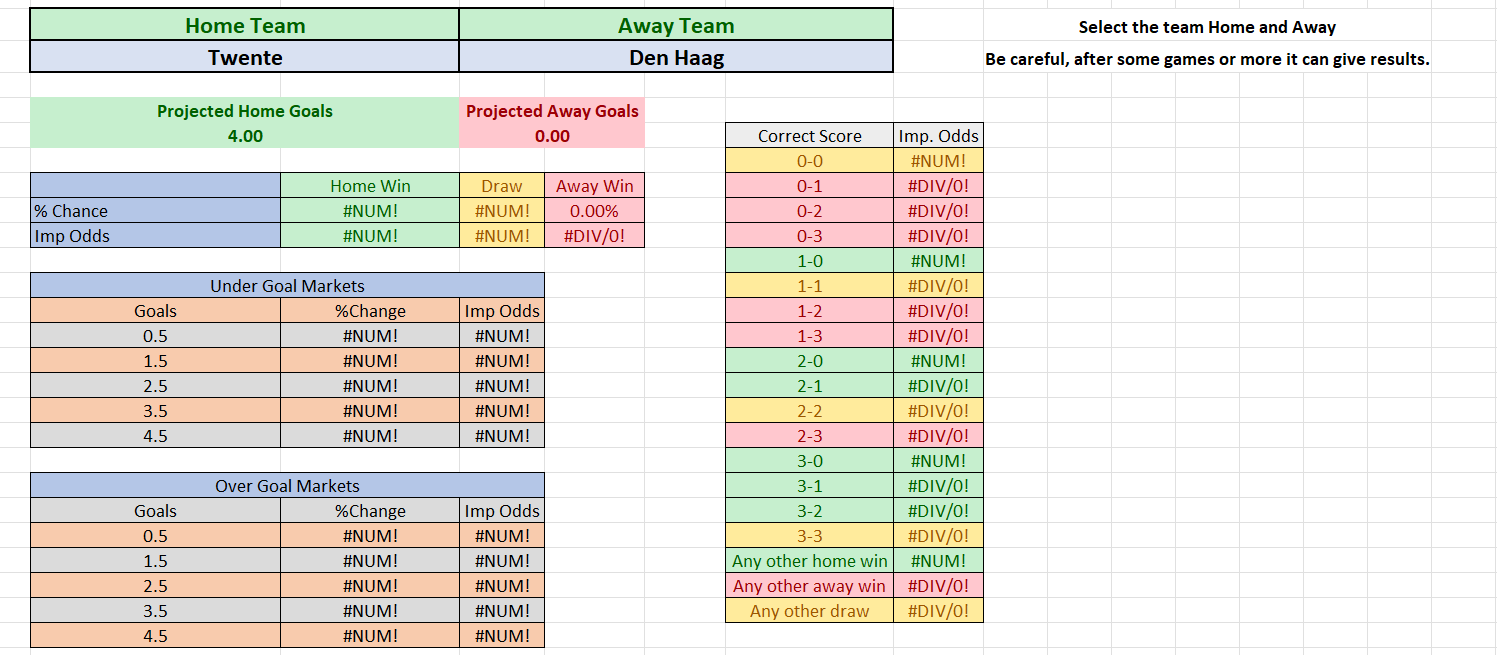
🎯 Prediction Sheet
The main feature of the workbook is the Prediction sheet.
The user selects:
Home Team: [Dropdown]
Away Team: [Dropdown]
After selecting the two teams, Excel automatically retrieves the relevant statistics and generates a prediction.
The prediction system can evaluate:
- Current league position
- Last 5 form
- Last 10 form
- Home form
- Away form
- Goals scored
- Goals conceded
- Head-to-head
- BTTS statistics
- Over/Under statistics
- Home advantage
- Attacking strength
- Defensive strength
The final output can provide predicted probabilities for:
1X2
- Home Win %
- Draw %
- Away Win %
Goals
- Over 1.5 %
- Over 2.5 %
- Over 3.5 %
- Under 2.5 %
BTTS
- BTTS Yes %
- BTTS No %
Correct Score
- Most likely score
- Alternative score
⚽ Expected Goals
An advanced version of the workbook can calculate estimated expected goals for both teams.
For example:
Expected Home Goals: 1.75
Expected Away Goals: 1.20
These values can then be used to generate a probable scoreline such as:
2–1
The expected-goals calculation can combine attacking strength, defensive weakness, home advantage and recent performance.
📌 1X2 Prediction
The workbook can automatically generate:
- 1 — Home Win
- X — Draw
- 2 — Away Win
The model can also show the probability behind each outcome instead of displaying only a single prediction.
Example:
| Market | Probability |
|---|---|
| Home Win | 52% |
| Draw | 25% |
| Away Win | 23% |
This makes the prediction easier to understand and compare.
⚽ Over / Under Goals
The Excel model includes an extensive goal-market section.
It can calculate:
- Over 0.5
- Over 1.5
- Over 2.5
- Over 3.5
- Under 1.5
- Under 2.5
- Under 3.5
The model uses historical goals, recent form, home/away statistics and expected goals to estimate the probability of each market.
🤝 BTTS Prediction
The Both Teams To Score (BTTS) section predicts whether both teams are likely to score.
It can provide:
BTTS YES
or
BTTS NO
The calculation can consider:
- Home team’s scoring frequency
- Away team’s scoring frequency
- Defensive records
- Recent BTTS results
- Home/Away BTTS statistics
- H2H BTTS statistics
- Expected goals
🧮 Correct Score Prediction
The workbook can generate several possible scorelines based on the expected goals model.
For example:
- 2–1 — 14.2%
- 1–1 — 12.8%
- 2–0 — 10.5%
- 1–0 — 9.7%
- 2–2 — 7.9%
This gives users more information than simply predicting the match winner.
📋 Fixture Prediction Table
A separate prediction table can contain every fixture in the season:
| Round | Home | Away | 1 | X | 2 | O2.5 | U2.5 | BTTS | Score |
| 1 | Team A | Team B | 48% | 27% | 25% | 61% | 39% | YES | 2–1 |
The table can automatically update when statistical data and results are entered.
📉 Prediction Accuracy
The workbook can also track how accurate the prediction model has been.
It can calculate:
- Total predictions
- Correct 1X2 predictions
- Incorrect predictions
- Accuracy %
- Correct Over/Under predictions
- Correct BTTS predictions
- Correct score predictions
This allows the model to be evaluated throughout the season instead of simply assuming that predictions are accurate.
📊 Dashboard
An optional Dashboard sheet can provide a visual overview of the Eredivisie season.
The dashboard can include:
- Current league table
- Top scoring teams
- Best defensive teams
- Current form
- Home performance
- Away performance
- Over 2.5 statistics
- BTTS statistics
- Upcoming fixtures
- Prediction summary
- Prediction accuracy
- Top predicted matches
Charts can be added for goals, form, points and prediction accuracy.
🔄 Automatic Updating
The workbook is designed so that new match results can be entered regularly. Eredivisie 2026/2027
Once the results are updated, the formulas can automatically recalculate:
- League standings
- Team statistics
- Recent form
- Home/Away statistics
- Goals averages
- BTTS percentages
- Over/Under percentages
- Predictions
- Prediction accuracy
This makes the file useful throughout the entire 2026/2027 Eredivisie season, rather than only at the beginning of the campaign.
🗓️ Important 2026/27 Schedule Information
The official Eredivisie calendar confirms that the season begins on Friday 7 August 2026, with SC Cambuur vs Excelsior Rotterdam as the opening fixture. Defending champions PSV begin at home against Fortuna Sittard.
The winter break begins after the matches on 20 December 2026, with the second half of the league scheduled to restart on 8 January 2027. The final Eredivisie matchday is scheduled for 23 May 2027.
Because Dutch clubs can be involved in UEFA competitions, some fixtures may be moved or have their exact kick-off times adjusted during the season. The official KNVB programme should therefore be treated as the primary fixture reference.
🏆 Main Features Eredivisie 2026/2027
The complete Eredivisie 2026/2027 Excel prediction system can therefore include:
- Complete 2026/27 fixtures
- 34 matchweeks
- Automatic league table
- Team database
- Last 5 form
- Last 10 form
- Home form
- Away form
- Head-to-head
- Goals analysis
- Expected goals
- 1X2 prediction
- Double Chance
- Over/Under
- BTTS
- Correct Score
- Clean Sheet prediction
- Team scoring probability
- Match confidence rating
- Prediction accuracy
- Automatic formulas
- Team dropdown selection
- Fixture-by-fixture predictions
- Dashboard
- Charts
- Historical results
- Performance tracking
The workbook is intended as a statistical football analysis tool. Predictions are estimates generated from historical and current statistical information and should not be considered guaranteed results or financial advice. For betting decisions, users should independently evaluate team news, injuries, suspensions, line-ups, motivation, fixture congestion and market prices before making any decision.