
Portugal Primeira Liga 2026/2027 Football Excel Fixture Prediction
The Portugal Primeira Liga 2026/2027 Football Excel Fixture Prediction is a comprehensive and interactive Excel workbook designed for football fans, analysts, statistics enthusiasts, and users who want to study the Portuguese top-flight season using fixtures, results, league standings, team form, historical statistics, and match prediction models.
The 2026/2027 Primeira Liga season is the 93rd edition of Portugal’s top division, with 18 clubs competing in a 34-match double round-robin format. Each team plays every other team twice, once at home and once away. The season is scheduled to run from August 2026 until May 2027.
The workbook is structured to make it easy to follow the entire Portuguese league season while also providing a statistical framework for predicting upcoming fixtures. The official fixture calendar has already been released, including the first-round matches such as FC Porto vs FC Alverca, SL Benfica vs Académico, Estrela Amadora vs Sporting CP, and Vitória SC vs Arouca.
Main Features
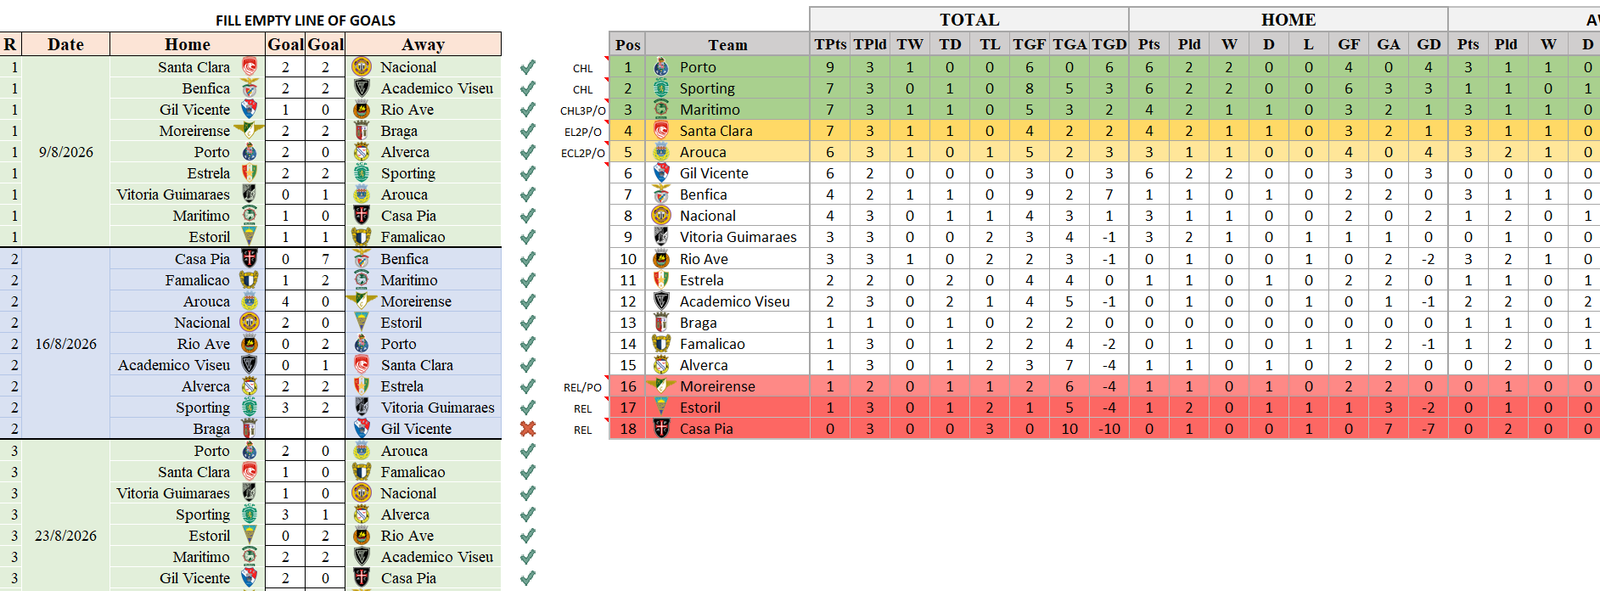
1. Complete 2026/2027 Fixture Calendar
The Excel file contains the full Primeira Liga fixture schedule, organized by:
- Matchweek
- Match date
- Home team
- Away team
- Home result
- Away result
- Half-time score
- Full-time score
- Match status
- Prediction
- Prediction result
With 18 teams and 34 rounds, the workbook can track the complete league campaign from the opening weekend through the final matchday.
2. Interactive Prediction Sheet
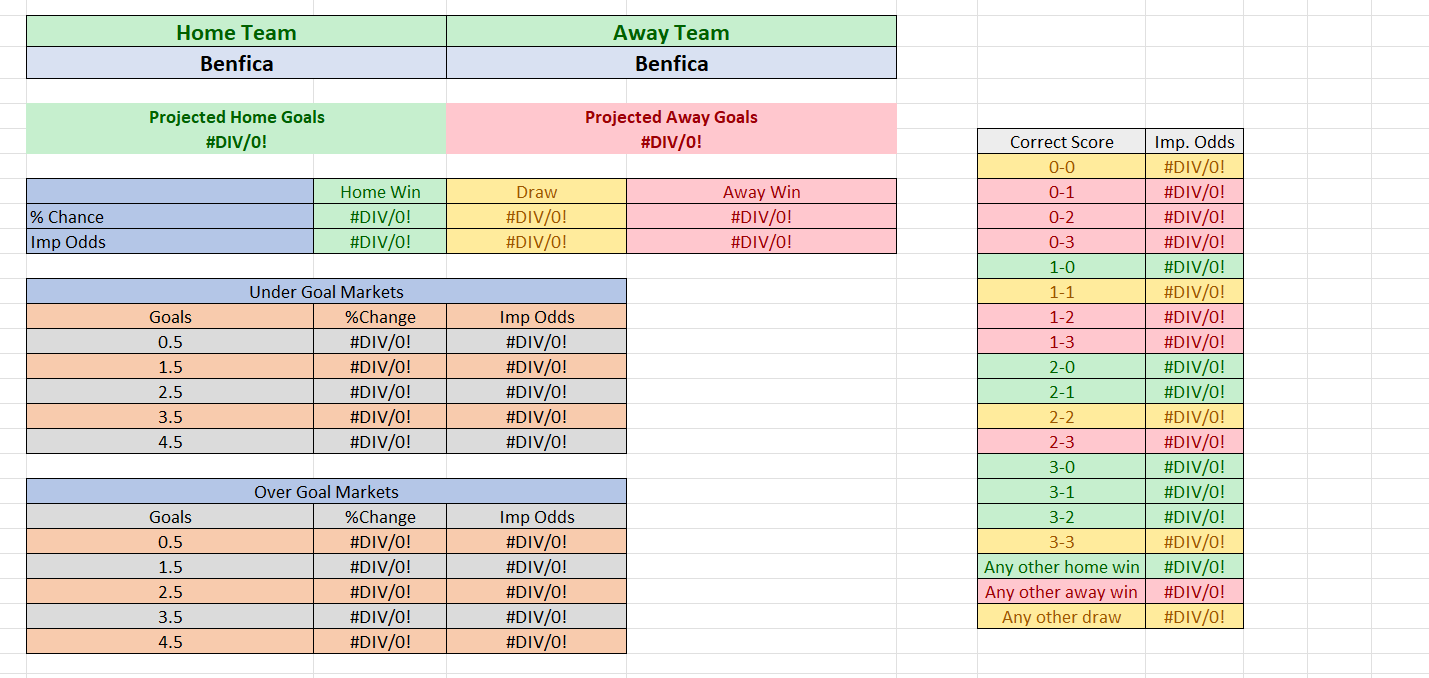
The Prediction sheet is the main section of the workbook.
Users can select:
Home Team → Away Team
from Excel dropdown menus, and the workbook automatically calculates a statistical prediction.
The prediction can include:
- Home win probability
- Draw probability
- Away win probability
- Predicted score
- Expected home goals
- Expected away goals
- Over 1.5
- Over 2.5
- Over 3.5
- Under 1.5
- Under 2.5
- Under 3.5
- BTTS – Yes
- BTTS – No
- Double Chance
- 1X
- X2
- 12
This makes the workbook useful not only for looking at the fixture list but also for comparing the statistical strength of the two teams.
3. Last 5 Matches Form
The model analyzes each team’s most recent five matches.
For each team it can calculate:
- Wins
- Draws
- Losses
- Goals scored
- Goals conceded
- Goal difference
- Points earned
- Average goals scored
- Average goals conceded
A simple form indicator can then be created, for example:
W-W-D-L-W
This allows the prediction model to recognize whether a team is currently improving, declining, or maintaining consistent form.
4. Last 10 Matches Analysis
The workbook can also use the last 10 matches to create a larger statistical sample.
This reduces the influence of one unusual result and gives the prediction model more information about the team’s recent performance.
The analysis can include:
- 10-match points average
- Goals per game
- Goals conceded per game
- Win percentage
- Draw percentage
- Loss percentage
- Clean-sheet percentage
- BTTS percentage
- Over 2.5 percentage
5. Home and Away Form
One of the most important features of the model is separating home and away performance.
For the home team, the workbook analyzes its home matches.
For the away team, it analyzes its away matches.
This can provide a more realistic prediction than simply comparing overall league positions.
For example, a team may have an excellent overall record but perform significantly worse away from home. Conversely, another team may be particularly strong at its own stadium.
6. Head-to-Head Statistics
The workbook can include previous meetings between the selected teams.
The H2H section can calculate:
- Previous wins for Home Team
- Previous draws
- Previous wins for Away Team
- Average goals
- BTTS frequency
- Over 2.5 frequency
- Recent H2H results
The H2H data is used as an additional factor rather than the only prediction source.
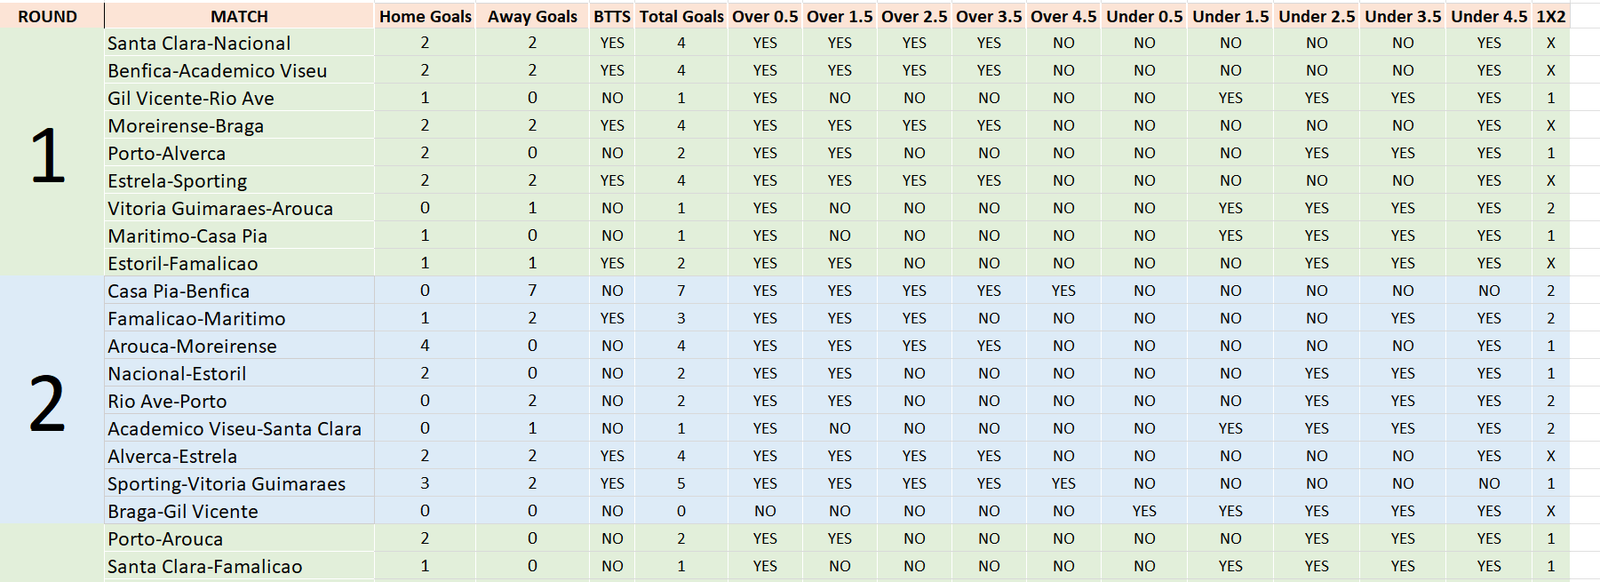
7. League Table
A dynamic Standings sheet can automatically calculate the Primeira Liga table.
Columns can include:
| Pos | Team | P | W | D | L | GF | GA | GD | Pts |
|---|
The table can automatically update when match results are entered.
The workbook can therefore be used throughout the season rather than being limited to preseason predictions.
8. Goals Statistics
The Excel file can track attacking and defensive performance for every team.
Statistics include:
- Goals scored
- Goals conceded
- Goals per match
- Home goals
- Away goals
- Home goals conceded
- Away goals conceded
- Average total goals
- Goal difference
These statistics can be incorporated into the prediction formula.
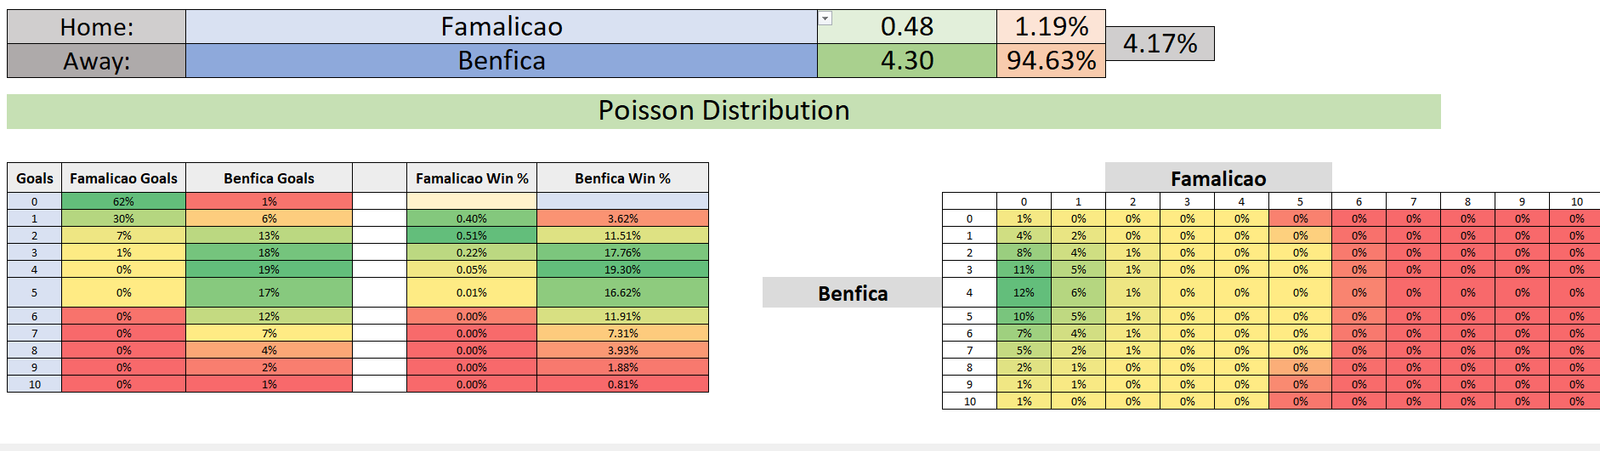
9. Over/Under Prediction
The workbook includes an Over/Under Goals Prediction section.
It can estimate probabilities for:
- Over 0.5
- Over 1.5
- Over 2.5
- Over 3.5
- Over 4.5
- Under 1.5
- Under 2.5
- Under 3.5
- Under 4.5
For example, if the model estimates a high combined expected-goal value, the Over 2.5 probability can increase.
10. BTTS Prediction
The workbook also includes Both Teams To Score (BTTS) analysis.
It evaluates:
- Home team’s scoring frequency
- Away team’s scoring frequency
- Home team’s clean sheets
- Away team’s clean sheets
- Recent BTTS results
- H2H BTTS history
The final output can show:
BTTS: YES
or
BTTS: NO
together with a percentage probability.
11. Correct Score Prediction
The Prediction sheet can also provide a projected score such as:
- 1–0
- 1–1
- 2–0
- 2–1
- 2–2
- 3–1
- 0–0
The predicted score is generated from the expected attacking and defensive performance of both teams.
12. Prediction Model
The model can combine several statistical components rather than relying on a single statistic.
For example:
Prediction Score =
- 20% Last 5 Form
- 15% Last 10 Form
- 20% Home/Away Performance
- 15% Goals Scored
- 10% Goals Conceded
- 10% League Position/Strength
- 10% Head-to-Head
The weighting can be adjusted inside the workbook.
This allows the Excel file to be customized according to the user’s preferred prediction strategy.
13. Match Confidence
Each prediction can receive a confidence level.
For example:
High Confidence
Medium Confidence
Low Confidence
or a numerical score such as:
82% Confidence
The confidence rating helps distinguish between matches where the statistical difference between the teams is large and matches where the teams are closely matched.
14. Fixture Analysis
The workbook can analyze every upcoming fixture and display a summary such as:
Home Team: Benfica
Away Team: Académico
Home Form: W-W-W-D-W
Away Form: L-D-W-L-D
Home Average Goals: 2.10
Away Average Goals: 0.95
Predicted Result: Home Win
Predicted Score: 2–0
Over 2.5: 64%
BTTS: 42%
The exact values will change as real results are entered into the workbook.
15. Team Comparison
A dedicated comparison area can show the difference between the selected teams.
For example:
| Statistic | Home Team | Away Team |
|---|---|---|
| League Position | — | — |
| Points | — | — |
| Last 5 Points | — | — |
| Last 10 Points | — | — |
| Goals/Game | — | — |
| Goals Conceded/Game | — | — |
| Home/Away Win % | — | — |
| BTTS % | — | — |
| Over 2.5 % | — | — |
This provides an immediate statistical overview before looking at the final prediction.
16. Automatic Excel Formulas
The workbook can be designed using Excel formulas such as:
XLOOKUPINDEXMATCHSUMIFSCOUNTIFSAVERAGEIFSIFIFSIFERRORFILTERUNIQUESORT
Dropdown menus can be created with Data Validation, allowing the user to select teams without manually typing their names.
17. Dashboard
A visual dashboard can summarize the Primeira Liga season.
Possible dashboard elements include:
- Current league table
- Top teams
- Best attack
- Best defense
- Top home teams
- Best away teams
- Current form
- Upcoming fixtures
- Prediction summary
- Over/Under statistics
- BTTS statistics
- Average goals per match
This gives the workbook a professional football-statistics appearance.
18. 2026/2027 Fixture Accuracy
The fixture section should be based on the released 2026/27 calendar rather than an invented schedule. The published calendar contains all 34 rounds, with the opening round scheduled for the first weekend of August and the final round scheduled for May 2027.
Because Portuguese fixtures can be moved for television, domestic cup competitions, or European commitments, the exact kickoff date and time should be treated as changeable even when the matchup itself is already known.
19. Useful for the Full Season
The Excel file is designed to be updated week by week.
After each round, the user can enter the actual results and the workbook can automatically update:
- League table
- Team form
- Last 5 matches
- Last 10 matches
- Home statistics
- Away statistics
- Goals averages
- BTTS statistics
- Over/Under statistics
- H2H records
- Upcoming match predictions
This makes it a dynamic 2026/2027 Primeira Liga prediction system, rather than simply a static fixture list.
20. Important Disclaimer
The predictions generated by this Excel file are based on statistical calculations and historical/current performance indicators. Football is unpredictable, and factors such as injuries, suspensions, squad rotation, tactics, motivation, transfers, managerial changes, weather, and unexpected match events can significantly influence results.
Therefore, the predictions should be considered statistical indicators and analytical tools, not guaranteed results. They should not be used as the sole basis for betting decisions.
The objective of the workbook is to provide a structured way to analyze the Portugal Primeira Liga 2026/2027 season, compare teams, study fixtures, evaluate form, and generate probability-based football predictions.