
Ligue 1 2026/2027 Football Excel Fixture & Prediction Download
The Ligue 1 2026/2027 Football Excel Fixture & Prediction file is a comprehensive football analysis and prediction spreadsheet designed to organize the complete French Ligue 1 season, track fixtures and results, analyze team performance, and generate statistical predictions for upcoming matches. The 2026/27 Ligue 1 season officially begins on 21 August 2026 and concludes on 29 May 2027, with 34 matchdays and 18 clubs competing throughout the campaign.
The Excel file is designed to provide much more than a simple fixture calendar. It combines the complete season schedule with team statistics, recent form, home and away performance, head-to-head records, goals analysis, league standings, and automated match predictions. Users can follow the season from the opening weekend through the final matchday while continuously updating results and allowing the prediction calculations to reflect the latest available data.
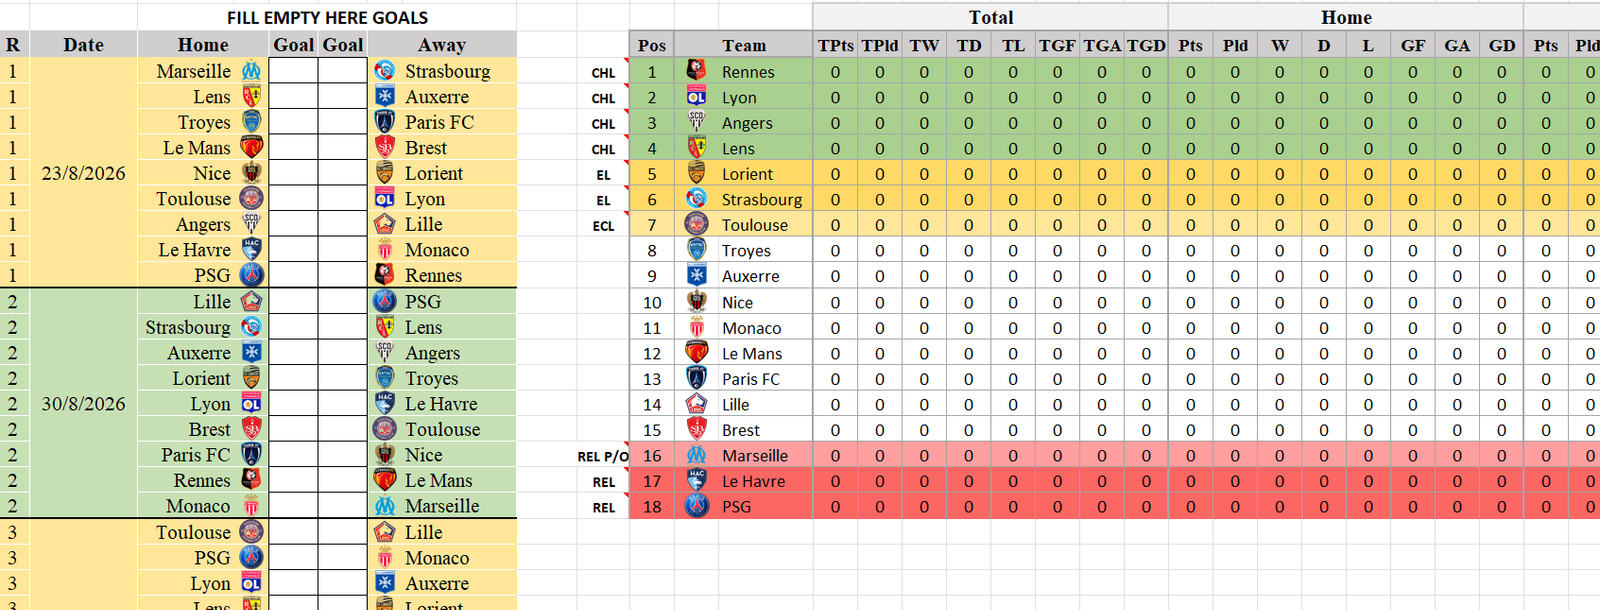
Complete Ligue 1 2026/2027 Fixtures
The workbook contains the full Ligue 1 2026/27 fixture list, organized by matchday from Jornada 1 through Jornada 34. Each fixture can include the matchday, date, home team, away team, result, home goals, away goals, match outcome, and additional prediction statistics.
The official schedule includes major opening fixtures such as Olympique de Marseille vs RC Strasbourg Alsace and Paris Saint-Germain vs Stade Rennais FC on Matchday 1. Matchday 2 immediately features LOSC Lille vs Paris Saint-Germain and AS Monaco vs Olympique de Marseille, providing important early-season fixtures for analysis.
The spreadsheet can therefore be used as a complete Ligue 1 season calendar as well as an analytical database.
Prediction Sheet
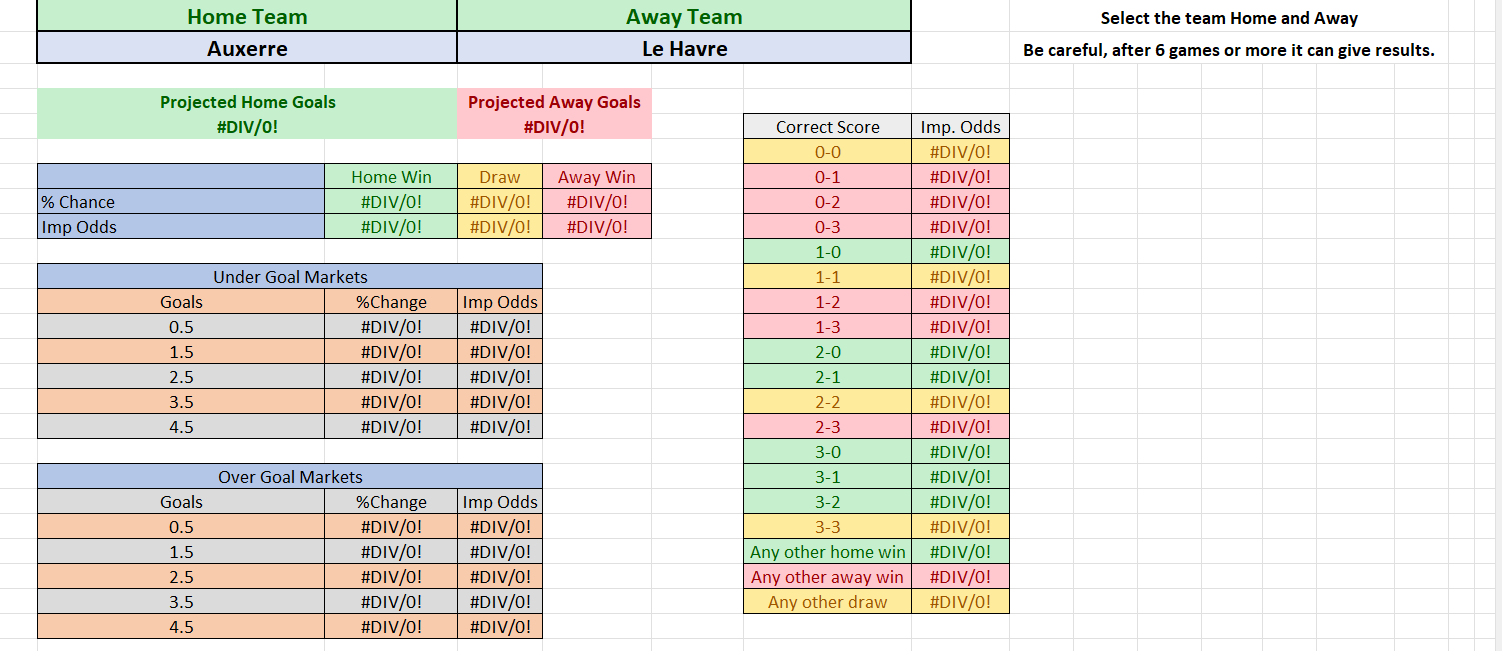
One of the main features of the Excel file is the dedicated Prediction sheet. Users can select a Home Team and Away Team from dropdown menus, and the spreadsheet automatically calculates a prediction based on the available statistical information.
The prediction system can evaluate several factors, including:
- Last 5 matches
- Last 10 matches
- Overall team form
- Home form
- Away form
- Goals scored
- Goals conceded
- Average goals scored
- Average goals conceded
- Head-to-head results
- Home advantage
- Recent winning percentage
- Draw percentage
- Losing percentage
- Over/Under trends
- BTTS statistics
- Clean-sheet percentage
- Recent attacking performance
- Recent defensive performance
The objective is to create a more complete statistical picture rather than relying on a single statistic.
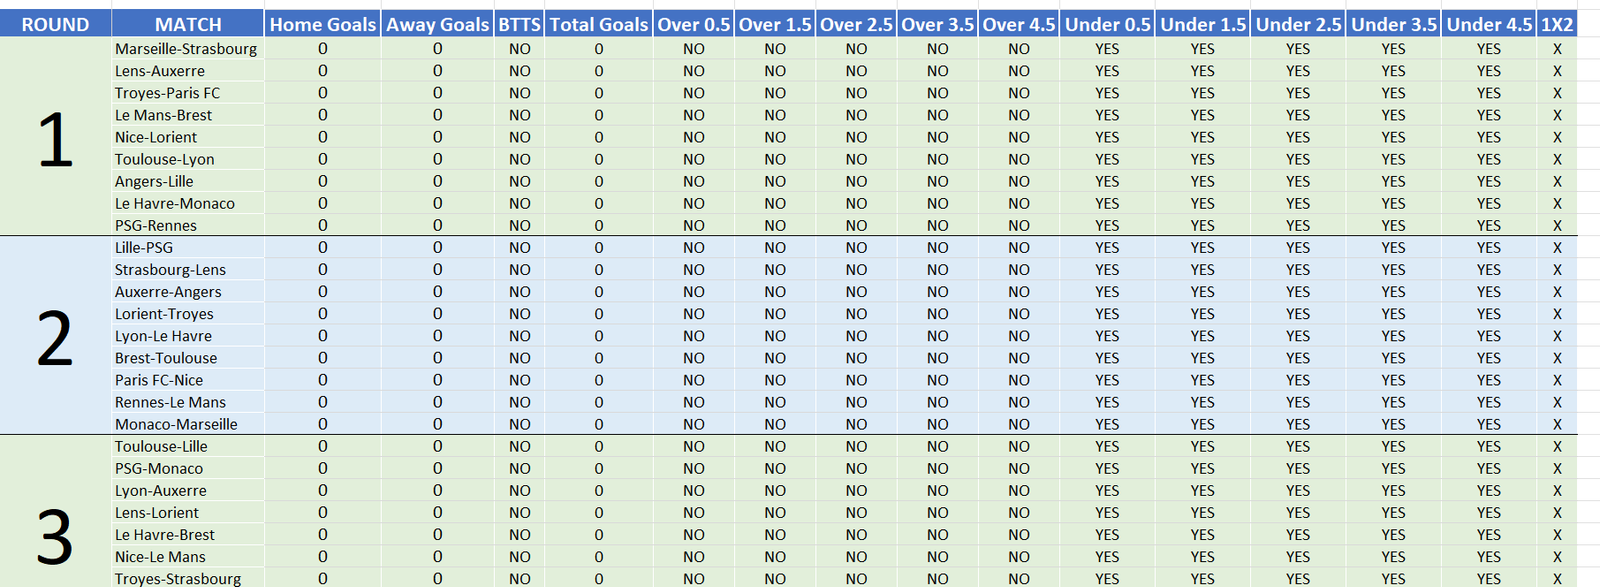
Last 5 and Last 10 Matches
The workbook can calculate each team’s recent performance using the last 5 matches and last 10 matches.
For example, the spreadsheet can calculate:
Last 5 Form:
W-W-D-L-W
Last 10 Form:
W-W-D-W-L-W-D-W-L-W
These results can then be converted into numerical form points and percentages. A weighting system can give greater importance to recent matches, allowing the prediction model to react to changes in team performance during the season.
This is particularly useful because a team’s performance at the beginning of the season may be very different from its performance several months later.
Home and Away Form
Home and away performance is separated to make the prediction more realistic.
For the home team, the spreadsheet can analyze its recent home matches, including:
- Home wins
- Home draws
- Home defeats
- Home goals scored
- Home goals conceded
- Home average goals
- Home clean sheets
- Home BTTS percentage
- Home Over 1.5
- Home Over 2.5
- Home Under 2.5
For the away team, the same statistics can be calculated specifically from away matches.
This allows the prediction to recognize situations where a team is significantly stronger at home than away.
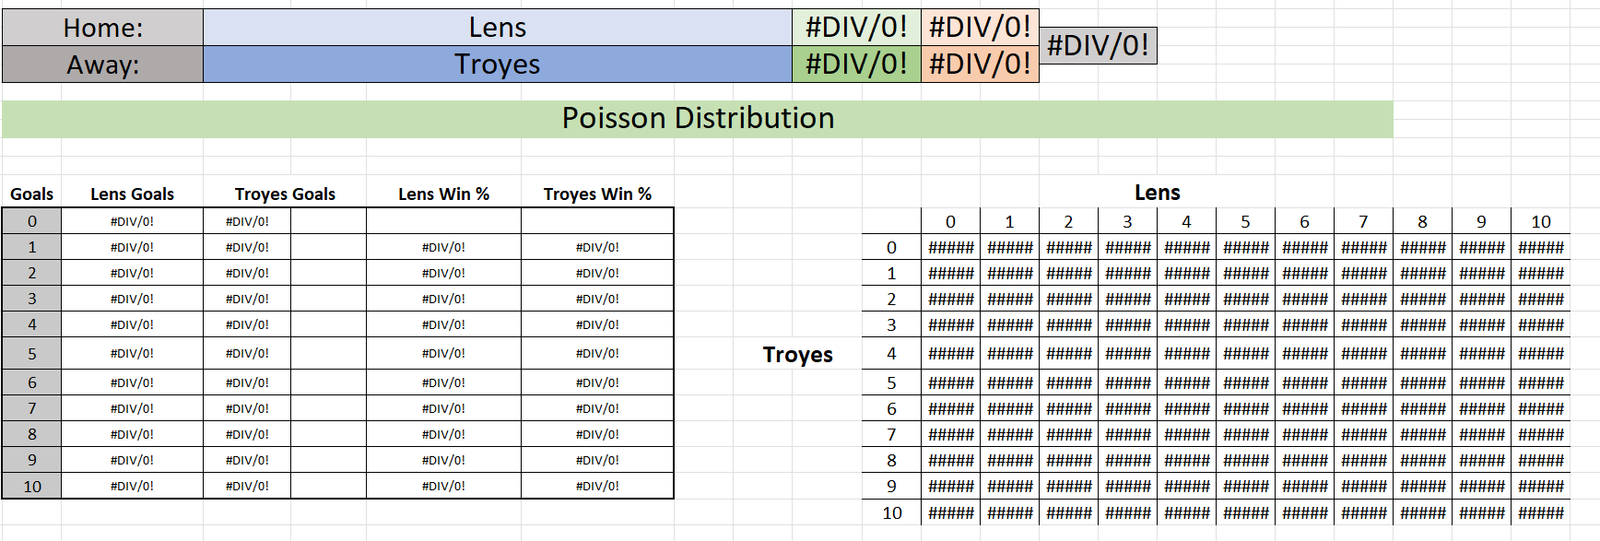
Head-to-Head Analysis
A dedicated H2H section can analyze previous meetings between the selected teams.
The spreadsheet can calculate:
- Previous H2H wins
- Previous H2H draws
- Previous H2H defeats
- Average H2H goals
- H2H Over 2.5 percentage
- H2H Under 2.5 percentage
- H2H BTTS percentage
- Recent H2H results
For example, when selecting a home team and an away team, the Prediction sheet can automatically search the historical results database and calculate their previous meetings.
Goals Prediction
The workbook can also provide a statistical goals prediction.
Possible outputs include:
Predicted Home Goals
Predicted Away Goals
Predicted Total Goals
The calculation can combine attacking strength, defensive weakness, home advantage, recent form, and historical scoring patterns.
The spreadsheet can then convert the expected goals into potential score lines such as:
- 1-0
- 1-1
- 2-0
- 2-1
- 2-2
- 3-1
- 0-1
The predicted score should be considered a statistical estimate rather than a guaranteed result.
1X2 Prediction
The Excel file can automatically generate a primary 1X2 prediction:
- 1 = Home Win
- X = Draw
- 2 = Away Win
The prediction can also provide estimated percentages, for example:
Home Win: 52%
Draw: 27%
Away Win: 21%
These percentages are intended to represent the model’s statistical assessment based on the data entered into the workbook.
Over / Under Goals
A dedicated goals market section can analyze different goal lines.
The spreadsheet can calculate:
- Over 0.5
- Under 0.5
- Over 1.5
- Under 1.5
- Over 2.5
- Under 2.5
- Over 3.5
- Under 3.5
- Over 4.5
- Under 4.5
The most commonly used line is Over/Under 2.5 goals, where the model evaluates the scoring history of both teams.
The calculation can consider recent matches, home/away performance, goals scored, goals conceded, and H2H statistics.
BTTS Prediction
The workbook can also include Both Teams To Score (BTTS) analysis.
Possible predictions are:
BTTS – YES
or
BTTS – NO
The model can calculate the percentage of recent matches in which both teams scored.
For example:
Home Team BTTS: 70%
Away Team BTTS: 60%
H2H BTTS: 65%
These statistics can contribute to the final BTTS prediction.
League Table
A complete Ligue 1 Standings sheet can automatically calculate the league table after match results are entered.
The table can contain:
- Position
- Team
- Played
- Wins
- Draws
- Losses
- Goals For
- Goals Against
- Goal Difference
- Points
The table can automatically update after each completed match.
This allows the Excel file to function as a complete Ligue 1 season tracker rather than only a prediction tool.
Team Statistics
A separate Team Statistics sheet can provide an overview of every club.
Statistics can include:
- Matches played
- Wins
- Draws
- Losses
- Points
- Goals scored
- Goals conceded
- Goal difference
- Average goals scored
- Average goals conceded
- Home record
- Away record
- Clean sheets
- BTTS percentage
- Over 2.5 percentage
- Under 2.5 percentage
These statistics can be used by the Prediction sheet to create dynamic predictions.
Form Table
The workbook can include a dedicated Form Table showing the current performance of every team.
For example:
| Team | Last 5 | Points | GF | GA | Form |
|---|---|---|---|---|---|
| Team A | W-W-W-D-W | 13 | 10 | 4 | Excellent |
| Team B | W-D-L-W-D | 8 | 7 | 6 | Good |
| Team C | L-D-L-W-L | 4 | 5 | 9 | Poor |
This makes it easy to identify teams currently in strong or weak form.
Fixture Analysis
The fixture sheet can be used to analyze every match throughout the season.
Each row can contain:
Matchday | Date | Home Team | Away Team | Result | Home Goals | Away Goals | 1X2 Prediction | O/U Prediction | BTTS Prediction | Predicted Score
As actual results are entered, the workbook can compare the prediction against the final result.
This makes it possible to track the performance of the prediction model over the course of the season.
Prediction Accuracy
An advanced version of the workbook can include a Prediction Accuracy section.
This can measure:
- 1X2 prediction accuracy
- Over/Under accuracy
- BTTS accuracy
- Correct score accuracy
- Home win accuracy
- Draw accuracy
- Away win accuracy
For example, if the model has made 100 predictions and correctly predicted 61 match outcomes, the spreadsheet can calculate an overall 61% prediction accuracy.
This allows the user to evaluate the model objectively rather than simply following individual predictions.
Dashboard
A professional Dashboard can summarize the most important Ligue 1 information in one location.
The dashboard can display:
- Current league table
- Top teams
- Best attacking teams
- Best defensive teams
- Current form
- Upcoming fixtures
- Latest results
- Over/Under trends
- BTTS trends
- Prediction percentages
- Prediction accuracy
- Top goal-scoring teams
- Teams with the most clean sheets
Charts and conditional formatting can make the information easier to understand.
2026/2027 Season Calendar
The official Ligue 1 calendar contains 34 matchdays. The season starts in August 2026, includes a winter break after Matchday 14, resumes in January 2027, and finishes with simultaneous matches on the final two matchdays. The official schedule states that Matchday 33 will be played on 22 May 2027 and Matchday 34 on 29 May 2027.
The winter break begins around Matchday 14 in December, with Ligue 1 action resuming during the weekend of January 2, 2027.
Major Fixtures
The workbook can highlight important fixtures throughout the season, including matches involving major clubs such as Paris Saint-Germain, Marseille, Monaco, Lyon, Lille, Lens, Rennes and Strasbourg.
Some of the officially highlighted fixtures include:
- LOSC Lille vs Paris Saint-Germain
- Marseille vs Paris Saint-Germain
- Paris Saint-Germain vs Lyon
- Lens vs Marseille
- Lyon vs Marseille
- Lens vs Paris Saint-Germain
- Paris Saint-Germain vs Marseille
- Paris Saint-Germain vs Lens
- Marseille vs Lyon
- Lyon vs Paris Saint-Germain
These fixtures can be specially highlighted in the Excel calendar for easier identification.
Automatic Dropdown Selection
The Prediction sheet can use Excel Data Validation dropdowns.
The user simply selects:
Home Team → Paris Saint-Germain
Away Team → Olympique de Marseille
The spreadsheet then automatically retrieves the corresponding statistics and generates the prediction.
This eliminates the need to manually search through the database for every match.
Recommended Excel Structure
A complete Ligue 1 2026/27 workbook can be organized into the following sheets:
- Dashboard
- Prediction
- Fixtures
- Results
- League Table
- Team Stats
- Last 5 Form
- Last 10 Form
- Home Form
- Away Form
- Head-to-Head
- Goals
- Over Under
- BTTS
- Prediction Accuracy
- Teams
- Settings
This structure makes the workbook easier to maintain and allows formulas to reference a central results database.
Statistical Prediction Model
The final prediction can use a weighted model rather than relying on only one statistic.
For example:
Recent Form – 25%
Home/Away Form – 20%
Goals Statistics – 20%
Head-to-Head – 10%
Attacking Strength – 10%
Defensive Strength – 10%
Home Advantage – 5%
The weights can be adjusted depending on how advanced the Excel model is.
The final result can produce a combined prediction score and convert it into a percentage for the main markets.
Important Disclaimer
This Excel file is intended for football statistics, analysis, research and prediction purposes only. Predictions are based on historical and statistical information and cannot guarantee the outcome of any football match.
The model should not be used as the only basis for betting decisions. Football contains unpredictable factors such as injuries, suspensions, tactics, player rotation, red cards, refereeing decisions, transfers, motivation and unexpected events. Always use the predictions together with your own research and judgment.
Overall, the Ligue 1 2026/2027 Football Excel Fixture & Prediction workbook is designed to become a complete season-management and football-analysis tool, combining the official fixture calendar with automated statistics, team form, home/away analysis, H2H data, goals markets, BTTS, Over/Under analysis, league standings and an interactive prediction system. It can be continuously updated throughout the season so that the predictions become increasingly data-driven as more 2026/27 Ligue 1 results are entered.